Your first live dashboard in 2 weeks, FREE
GrowthBI
For CFOs, CTOs, CMOs, Head of Sales & CEOs

You Don't Trust The Numbers In Your Own Reports.

Here's the offer

An ex-Atlassian data consultant will build your first live dashboard.

Free.In 2 weeks.

Watch: why your last data project didn't stick. And what we'd do differently ↓

Claim Your Free Dashboard

Takes about 45 seconds. Harsh personally reviews every application.

Reason-why

Why Is The First Dashboard Free?

Short version: it's an audition for a 3 to 6 month engagement, not a free giveaway. Here's the honest answer.

  1. 1

    It's how we qualify a long-term engagement.

    We're not looking for one-off dashboard jobs. Our best work is 3 to 6 month engagements rebuilding the data layer of a mid-market business. The free dashboard is how we prove we're the right team to do that with you, before either side signs anything.

  2. 2

    You can't fake a working dashboard.

    Most data shops sell you a roadmap. We'd rather show you a live, working dashboard in your real systems, built by the same engineers who shipped data infrastructure at Atlassian, REA Group, SEEK and Airwallex. If the work isn't good, you'll know in 2 weeks, and we'd rather find that out now than 3 months into a paid build.

  3. 3

    It makes continuing a no-brainer.

    Most data providers sell you a roadmap and hope you don't notice when delivery falls short. We let you judge the actual work on your real systems in 2 weeks. By the end, you'll know if we're the right fit, and continuing feels obvious, not risky. For 20 to 500 staff businesses with messy multi-system data and the budget to fix it properly over 3 to 6 months. Not for one-chart gigs.

No credit card. No contract. Just sign your NDA and get started.

Trusted by

Montgomery Homes
Kingspan
Milsons
Aspect, Autism Spectrum Australia
EdSmart
AgriChain
PayLater Travel
Rate My Agent
WebEngage
Montgomery Homes
Kingspan
Milsons
Aspect, Autism Spectrum Australia
EdSmart
AgriChain
PayLater Travel
Rate My Agent
WebEngage

$3M annual impact, operational efficiency|$2M savings, on-time delivery & procurement|$1M+ sales uplift, conversion & forecasting

The diagnosis

Does Any Of This Sound Like You?

If you nod at two or more, you're losing money and time every week you wait.

You walked into a board meeting and couldn't answer the follow-up

You had to say "let me come back to you" because you couldn't drill in to your own numbers in real time.

Finance is reconciling reports manually 3-5 days a month

Numbers in different systems don't match, so the answer to "what's our revenue" depends on who you ask.

You've already paid for a dashboard project that didn't stick

It looked great in the demo. Six months later nobody trusts it and your team is back in Excel.

Finance, sales and ops show up with different versions of the same number

Most of every leadership meeting is spent arguing about whose data is right instead of deciding what to do.

You want to roll out AI but your data foundation isn't ready

You know it could transform your team. You just can't tell what would need to change to get there.

Why dashboards don't stick

A Dashboard Is The Tip Of The Iceberg.

It's 10% of the work. Most agencies build that 10% on top of someone else's broken foundation. Six months later you're back where you started, just with a prettier interface.

Above the waterline10%

What everyone sees

  • Colours
  • Charts
  • Layout
Below the waterline90%

What makes the numbers actually reconcile

  • Pipeline architecture
  • Data modelling
  • Governance
  • Definitions locked across teams

We do the 90% first. That's why our dashboards still hold up 3 years later.

Operational Impact, In The Millions

Here's what that looked like in practice across Australian businesses we've helped.

Advara HeartCare

Health Care

  • $3M/year operational impact
  • Operational efficiency lift
  • Unified clinical + ops view

Leadership couldn't see where capacity was leaking across sites. We built the data foundation and dashboards that surfaced the operational levers, unlocking $3M in annual operational impact from efficiency gains.

Kingspan

Manufacturing, global operations

  • $2M operational savings
  • 15% on-time delivery up
  • 20% emergency procurement down

Plant managers had no unified view of inventory, open orders or stock at risk. We rebuilt the foundation, connected the data and surfaced predictive analytics. Quarterly review went from reactive firefighting to proactive management.

Montgomery Homes

Residential construction, NSW

  • $1M+ sales uplift
  • Improved sales conversion
  • Sharper forecasting

Sales leadership couldn't track response times or cycle velocity. We connected HubSpot to a proper SQL data model and built dashboards that surfaced conversion and forecasting in real time. That unlocked over $1M in additional sales.

Milsons Fasteners

Distribution, national operations

  • 12% inventory reduction
  • Significant working capital released
  • One source of truth

Warehouse and finance teams ran on spreadsheets that drifted out of sync weekly. We built a unified inventory + sales model so both teams saw the same numbers, freeing up working capital that was trapped in stock.

AgriChain

Agriculture / supply chain

  • 20% faster truck turnaround
  • Improved commodity forecasting
  • Scalable data foundation

AgriChain needed accurate data and smart modelling across logistics and commodities. We delivered the foundation that cut 20% off truck turnaround time and sharpened forecasting across the supply chain.

PayLater TravelRate My Agent

SaaS

  • Customised CAC tracking
  • Acquisition + churn dashboards
  • Customer behaviour insights

Growth, product and finance pulled different numbers from different tools. We built customised CAC, acquisition, churn and customer behaviour metrics so leadership stopped arguing about whose numbers were right.

Hear It Straight From Our Clients

Short video stories from the leaders we've worked with.

Our process

Two Weeks. Your First Live Dashboard, Built On Your Real Data, FREE

01

Day 1-2: Diagnostic call

30-minute working session with the founder. We map your systems, pipelines, definitions and the 2-3 questions your board can't answer in real time.

02

Week 1: Foundation audit

We audit your full data stack, what's connected, what's not, what's trusted, what isn't. You get a written diagnosis: foundation score, what's broken, and the priority order to fix it.

03

Week 2: Your first live dashboard, FREE

We build your first live dashboard, in your real systems, at zero cost. Designed around the highest-priority question your board has been asking you. You see it come together as we build it, not just at the end.

Your Four Other Options (And Why They Stall)

If you don't work with us, you've got four paths. Here's how each one plays out.

Hire a permanent data analyst

3-month problem in this market. The strong ones get poached by enterprise. The available ones can't do all four data roles.

Hire offshore freelancers

Six weeks of cheap work, then the foundation has to be rebuilt properly. False economy.

Buy a generic SaaS reporting tool

Works for simple businesses. Falls over the moment your data lives in more than two systems.

Hire a Big 4 consulting firm

Excellent work. Three-month engagement, six-figure budget. At the end you have a report recommending what to build, not the thing built.

GrowthBI

  • Same calibre of work as the big firms
  • Done in weeks, not quarters
  • Delivered as a service, not a one-off project
  • We stay on as your data team
15+

Years inside Atlassian, REA, SEEK, Airwallex

30+

Australian businesses served

2 weeks

Average time to first live dashboard

$6M+

Operational impact unlocked for clients

Examples of dashboards

The Quality Of Work You Can Expect

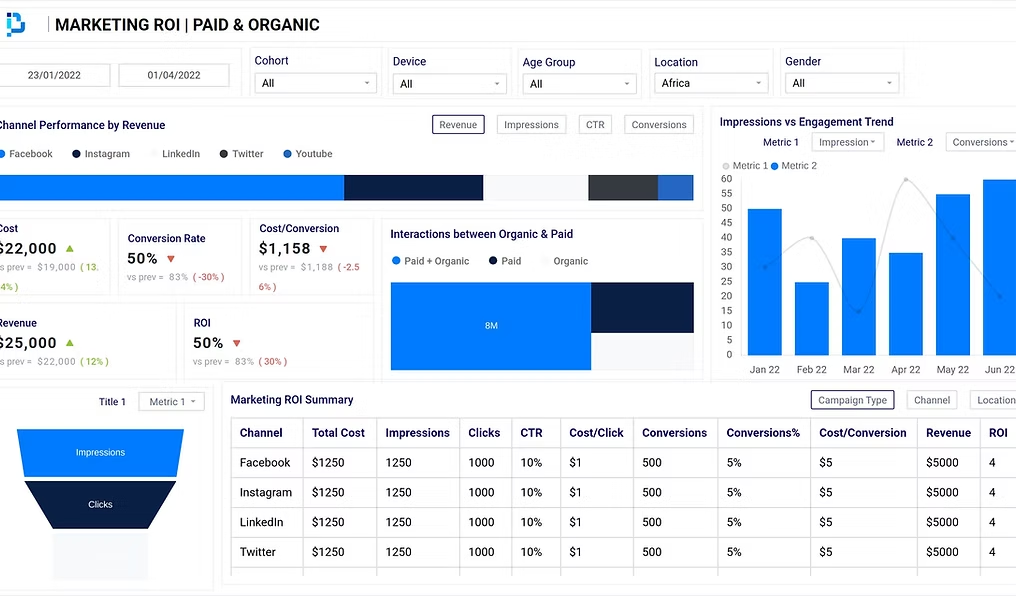
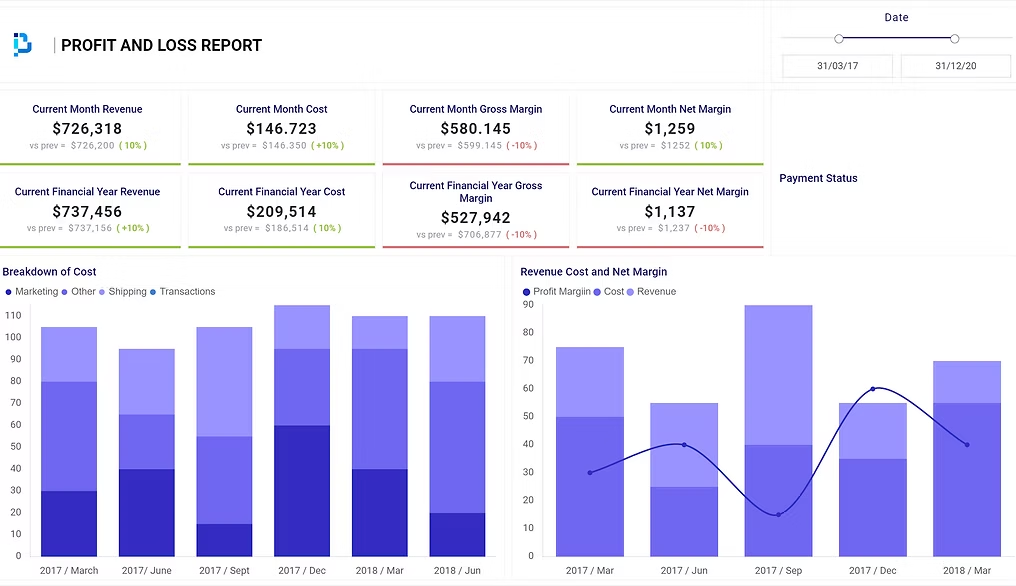
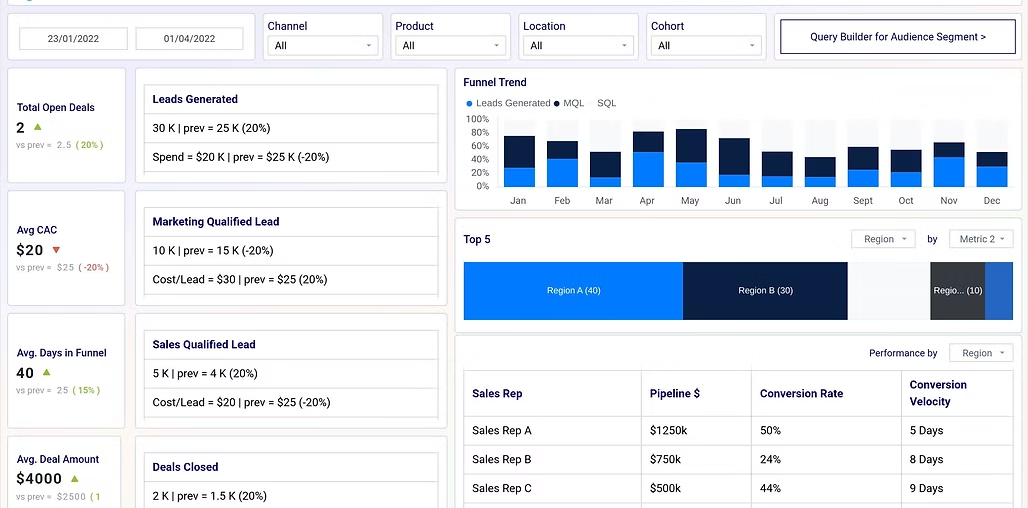
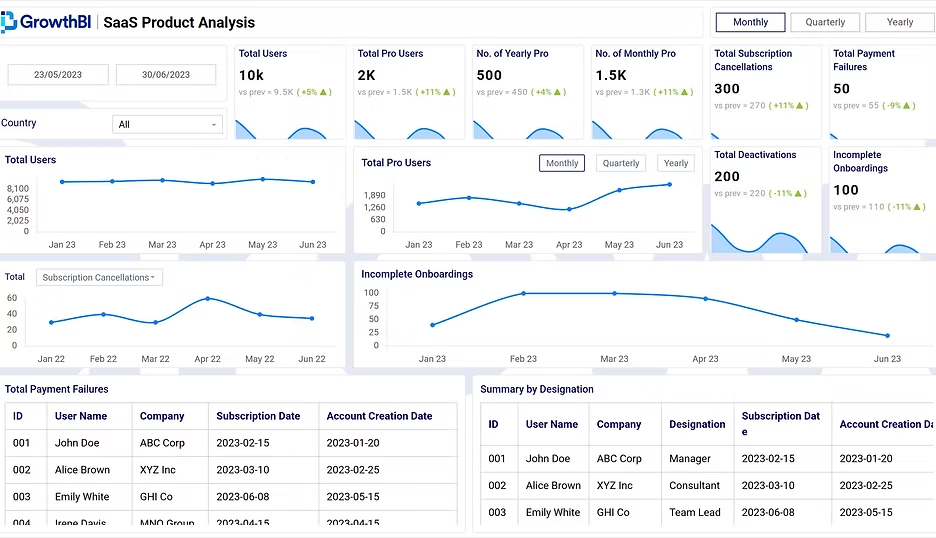
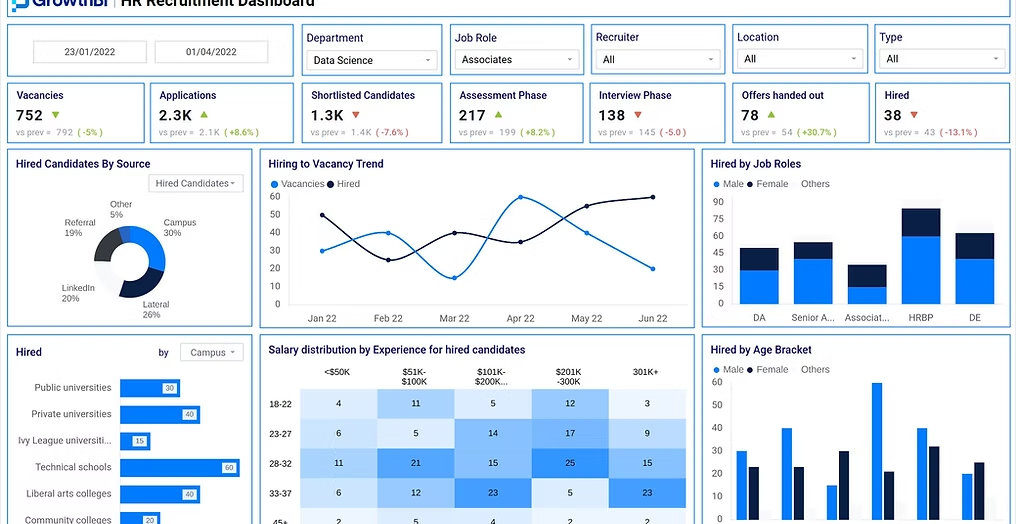
A small sample of dashboards we've built across finance, sales, operations and product. If a dashboard is the right week-2 fix for you, this is the bar.

Executive summary
Executive summaryLeadership
Finance P&L report
Finance P&L reportFinance
Sales funnel & pipeline
Sales funnel & pipelineSales
Product analysis
Product analysisProduct
HR & recruitment
HR & recruitmentPeople
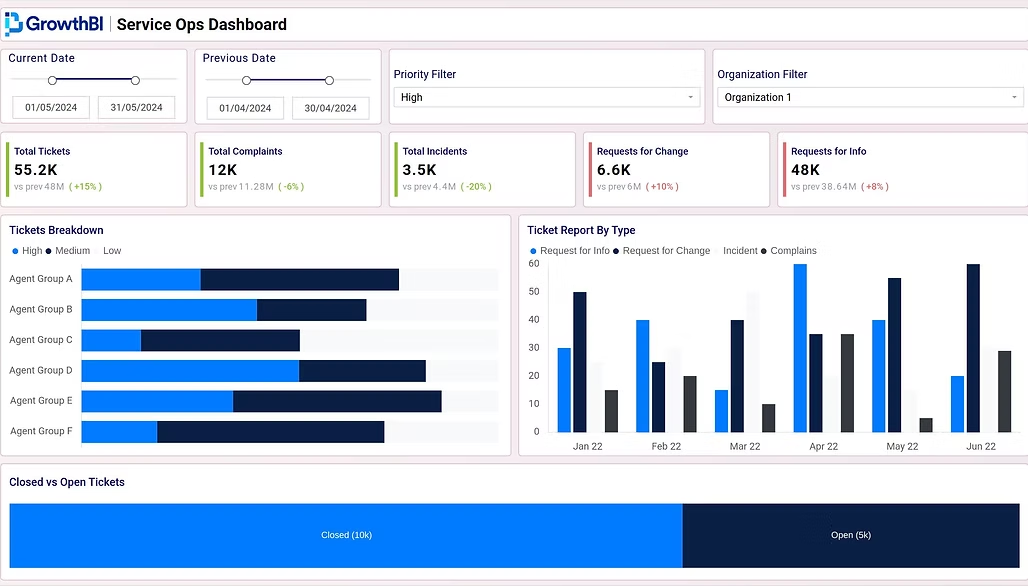
Service management
Service managementOperations

Sample dashboards. Real client data redacted.

Success Stories From Our Customers

GrowthBI helped our sales analytics boost lead conversion insights and improving sales forecasting accuracy by 15%.

Teagan Gagovski
Head Of Sales & Marketing
Montgomery Homes
Montgomery Homes

Dashboards and reporting automation using Power BI saved us over 20 hours per month and improved our operational reporting.

Yannick Darmalingam
Co-Founder
Slice (Paylater)
Slice (Paylater)

GrowthBI played a pivotal role in our growth at Rate My Agent in US region. Regular insights from Tableau dashboards were instrumental in honing our growth strategy.

Rohan Chandler
Chief Commercial Officer
Rate My Agent
Rate My Agent

GrowthBI helped us create Customer Retention Dashboards by setting up Fivetran for us. We gained clarity into marketing and sales conversion.

Ankur Gattani
Chief Growth Officer
WebEngage
WebEngage

Meet The Founder

Harsh Jaipuriar - Founder, GrowthBI
Harsh Jaipuriar
Founder, GrowthBI

Harsh spent 15 years inside the data teams at Atlassian, REA Group, SEEK and Airwallex. He's seen what good data infrastructure looks like at the top of the Australian tech market, and he's seen what happens when it breaks at scale.

He started GrowthBI because the businesses that need this work most can't get it. Companies past the founder-as-everything stage but not yet enterprise-scale, with department heads and a board to report to but no budget for the 30-person internal data team an Atlassian or Airwallex has. That gap is where most reporting projects fall over. GrowthBI fills it - the same data engineering, modelling and analytics work he used to do inside the big four, delivered as a service to businesses that need it without the internal team.


Background

  • 15+ years in enterprise data engineering
  • Built and scaled data systems at Atlassian, REA Group, SEEK, Airwallex
  • Specialist in SQL Server, Power BI, Azure Data Factory, Fivetran, BigQuery, Snowflake
  • Has worked with construction, manufacturing, distribution, education, e-commerce, and SaaS businesses

Founder & senior team, alumni of

Atlassian
REA Group
SEEK
Airwallex

Frequently Asked Questions

Who is this actually for?+

CFOs, Heads of Finance, Heads of Operations and senior leaders inside mid-market Australian businesses (roughly 20 to 500 staff) where the numbers don't reconcile across teams and it's slowing down decisions. We're built for ongoing 3 to 6 month engagements rebuilding the data layer - not one-off chart requests. If you're under 20 staff or only need a single dashboard built and walked away from, we're not the right fit.

How is this different from hiring a data analyst?+

An analyst sits inside the surface - building reports on top of broken data. We rebuild the foundation underneath so any analyst, BI tool or AI workflow on top actually returns numbers you can defend.

How is this different from a Big 4 consulting engagement?+

No 12-month roadmap upfront, no army of juniors, no 200-page deck. In 2 weeks senior engineers diagnose your data stack and build your first live dashboard in your real systems, then we scope what's next based on what you saw.

How much does this cost?+

The 2-week diagnosis and the first live dashboard we build in week 2 are free. No cost, no obligation. From there, ongoing engagements typically run 3 to 6 months as we rebuild the data layer and ship the dashboards your leadership team actually needs - scoped and quoted on the diagnostic call. Upfront: this is mid-tier pricing. Not Big 4, not offshore freelancer.

What systems do you work with?+

Most modern data stacks: Xero, MYOB, HubSpot, Salesforce, NetSuite, BigQuery, Snowflake, Azure, AWS, Power BI, Tableau, Looker - plus custom databases and ERPs. If you've got data in 2+ systems and the numbers don't reconcile, we can work with it.

Do we own the work, or are we locked in?+

You own everything we build - the data model, the pipelines, the dashboards. No proprietary lock-in. If you ever want to take it in-house, your team can.

What do I actually get in week 2?+

Your first live dashboard, built on your real data, in your real systems, at no cost. We design it around the highest-priority question your board has been asking you that you can't answer in real time. You see it come together as we build it, not just at the end.

What does the diagnostic call actually cover?+

30 minutes with the founder. We walk through your current data setup, the 2-3 questions your board has been asking that you can't answer in real time, and exactly what would need to be in place to fix that. No pitch deck.

What if we're not ready yet?+

Apply anyway. If the timing is wrong we'll tell you on the call and point you at what to do in the meantime. We'd rather have an honest 30 minutes than start a project that won't stick.

Same-day response

Ready To See Your Numbers Reconcile?

Two weeks. We diagnose what's broken, then fix one thing, live, in your systems, at no cost. Apply above and we'll respond the same business day.

Claim My Free Dashboard

Stop Arguing About Whose Numbers Are Right.

Two weeks. We diagnose what's broken in your data stack, then fix one thing, live, in your systems, at no cost.

Claim My Free Dashboard

30-minute call with the founder · No sales pitch